![]()
![]()
![]()
![]()
![]()
![]()
![]()
Combined fitting
Data-Configuration and compilation
As for the other types of fitting you must give SPARTAN an input catalog, in ascii format (simple text file). When SPARTAN opens it, it will read the header. Whatever you want to fit, the header of the catalog must start with two columns: ID and redshift with an hash(#) at the beginning of the line. THIS IS MANDATORY:
#ident redshift
For the combined fitting, the rest of the catalog starts with the spectroscopic information and only then we will add the photometry. So it is basically joining the configuration of spectrosopy (please see Spectroscopic fitting) and photometry (please see Photometric fitting). For example, if you want to fit 2 spectra with and 5 magnitude you will have a catalog that looks like this:
#ident redshift spec1 mag_spec1 mag_spec1_err spec2 mag_spec2 mag_spec2_err mag1 mag1_err mag2 mag2_err mag3 mag3_err mag4 mag4_err mag5 mag5_err
Each spectrum must be a text file with 3 columns (lambda, flux, error) and the name of each spectrum must finish by the extension .spec.
During the preparation of the data, each spectrum will be normalized to its own magnitude.
Danger
It is important to note that when fitting multiple spectra for a given object, these spectra must not overlap.
Tip
A good tip to combined data is to give a normalization magnitude to the spectra that is also one of the photometric part of the data.
You can find an example of such file here Combined input catalog
Fitting procedure: generalities
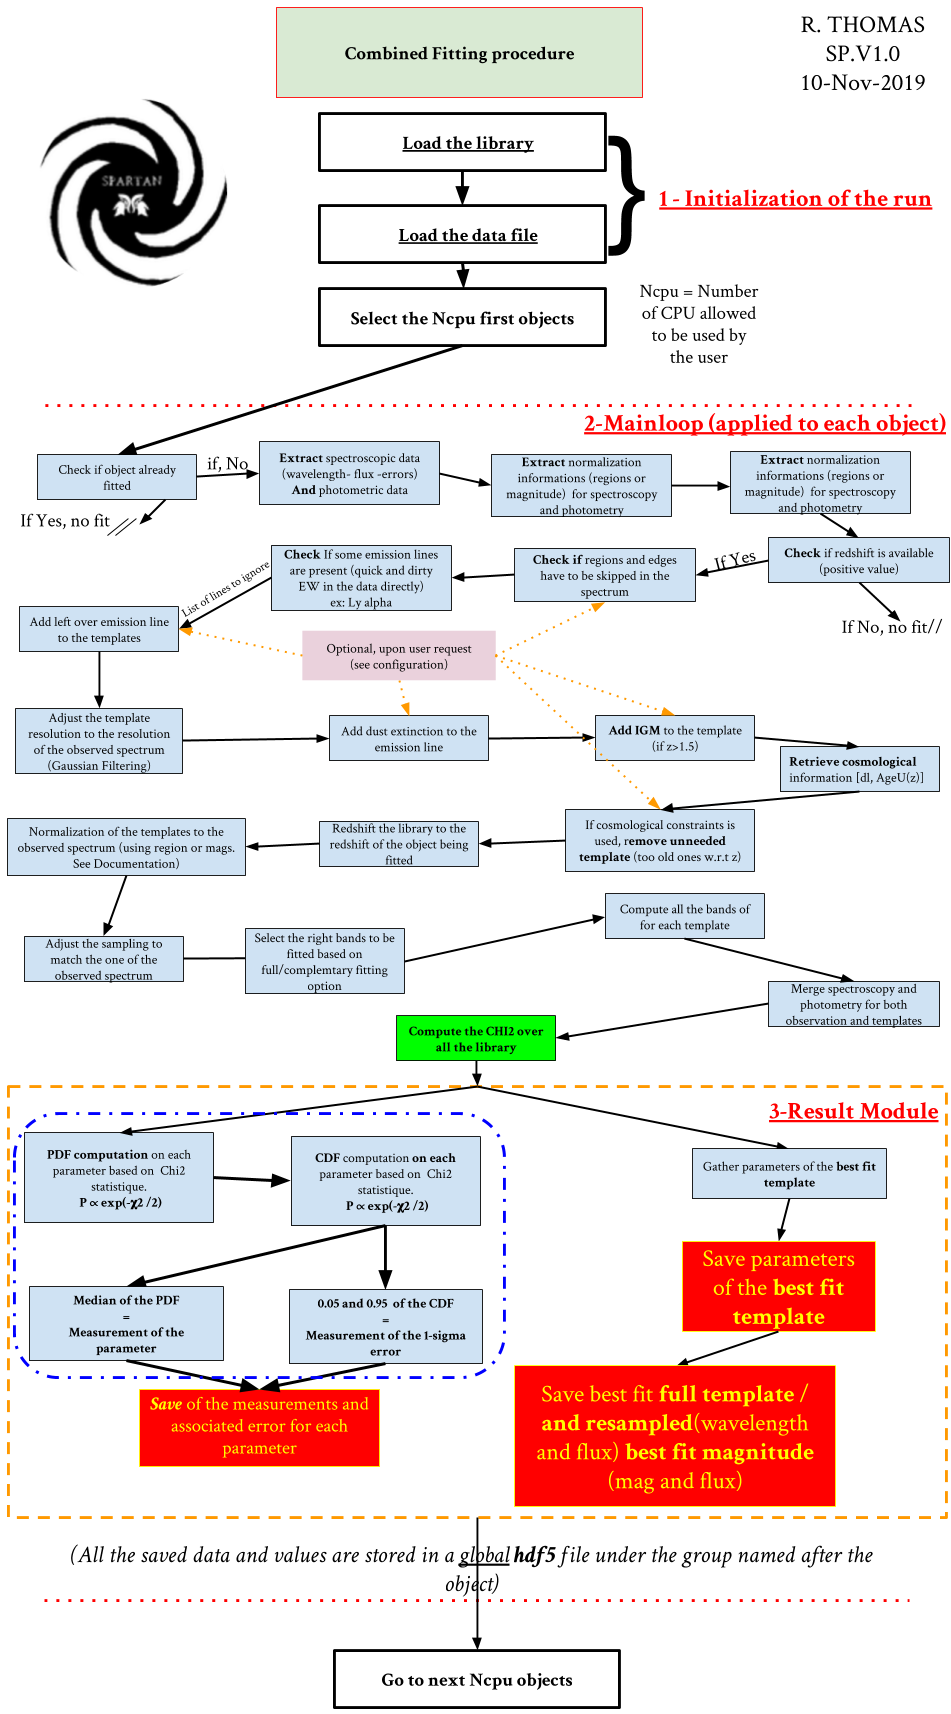
The flow chart shows the detailed procedure of the fit for a sample of photometrty and spectroscopy. It is composed of 3 parts:
The initialization of the run where we load the library and the sample to fit.
The main loop. Where are actually making the fit
The results module where we save the results of a fit and where the final catalog of parameter is created
We describe in detail each parts below in the following paragraphs.
The Initialization
Here SPARTAN loads the library that was computed from the configuration of the user. It loads both the table of parameters (and their names) and the table of templates. Everything is loaded from the .hdf5 library file. Then the code takes the _dat.hdf5 file that was created from the configuration and the catalog of data that was given. He will make a quick loop over the full sample to check if some objects were already fitted. If so they will be skipped (unless the user allow the overfit, c.f. configuration above and TUI.)
Note
This first check is important. It means you can stop a fitting run at any moment and start it again from where you stopped, without needing to start all the run over from the beginning.
From the left over objects to plot, SPARTAN will take the firsts Ncpu (see Configuration of a fitting run) object in the list and will send them to the fitting function. Each object will be fitted in parallel and Ncpu will be used.
The main function
For the combined fit the main function is a mainly a combination of both photometric and spectroscopic fitting process and the reader is refered to the corresponding page (Photometric fitting and Spectroscopic fitting). The two combined fitting specific step are:
The choice of the data to fit: As shown in the Configuration of a fitting run page, the user has the choice of fitting the full set of data of only the complementary ones. If you choose the full option then all spectroscopic and photometric data will be used. On the contrary, if you use the complementary option, SPARTAN will retain, the for fitting, only the complementary part. This means that when some data are overlapping SPARTAN will discard some of them, giving priority to the spectroscopy.
The way we fit combined data: As described in the paper presenting SPARTAN, we use a direct approach to fit combined data. Once the preparation of the data is done, we compute the chi2 on both photometry and spectroscopy at once. Which means we do not give any extra weight to the spectroscopy or to the photometry.
The result module
From the library of chi2, SPARTAN computes the PDF and the CDF for each parameter (see statistic). This will give access to the parameter measurements and their errors. If the user ask for it, the parameters from the best fit template (therefore without error) can be saved as well (see below). Aditionnaly, SPARTAN saves the best fit template (both original and resampled templates).
Data/Template Normalization
As the process is the same as for separated fit for photometry and spectroscopy we refer the user to the photometric and spectroscopic pages for this normalization.
Results: Final catalog production and GUI vizualization
At the end of the fitting run, SPARTAN creates automatically the final catalog. Depending on what you asked for, it will contain:
The ID, redshift and number of points used during the fitting run
The PDF parameters (measurement and errors, ex: PDF_SFR, m1s_SFR, p1s_SFR)
The Parameters from the best fit template (no errors in this case, ex: BF_SFR)
The best fit template and best fit magnitudes are also saved.
After the fit you can also load the result file into the SPARTAN GUI. This will allow you to visualize the individual fits (see below). It can also show you the global result of your sample. Go to the Graphical User interface: Visualizing results GUI documentation for more information.