![]()
![]()
![]()
![]()
![]()
![]()
![]()
Graphical User interface: Visualizing results
Start the GUI
As described in Getting started, spartan comes with a command line interface that allows you to access different parts of the code. One of the argument allows you to start the graphical user interface (GUI). To start it you must have a project configuration defined. To start it you use:
spartan -f your_project.conf -v
It tells spartan to load the result file of the ‘your_project.conf’ project and display it in the GUI (with the -v argument).
Description
When you start this command the GUI appears (see figure on the right). It is splitted in two main parts:
The Action area: This is where all the button that allows you to visualize results are set
The Display area: The display area where all results you want to see are displayed
The Action area is composed if 7 action widgets:
The Select ID drop down list: This is the list of all the object in your project. You can select whatever of them. When doing so, it display in the right of list information about that object. Either it was fitted (in green) or not fittted (in red). It also gives you the position in the list of that object.
The show fit button alloes you to display, in the display area, the fit of this galaxy.
The Previous and Next buttons allows you to quickly move in the list of objects without going throught the list again.
The Show Distributions and X vs Y button allow you to look at distribution of parameters (see below).
The Choose Plot Style drop down list allows you to choose between different matplotlib styles (black, white or gray).
Finally, the Save plot Data allows you to save the plotting data (data and best fit template) for the object you see in the Select ID list into the project directory.
Keyboard Shortcuts
The GUI has been developped to be used also without the mouse. In that spirit few keyboard shortcuts have coded:
press f : it will display the fit of the object selected in the Select ID list.
press n : it will display the fit of the next object and update the Select ID list to the next object as well.
press b : it will display the fit of the previous object and update the Select ID list to the nect object as well .
press s: It will save the data of the fit currently displayed in the Select ID list.
press ctrl+w : It will delate the tab you are currently seeing.
press ctrl+PageUp: It will change the display to the previous tab
press ctrl+PageDown: It will change the display to the next tab
Visualizing individual results
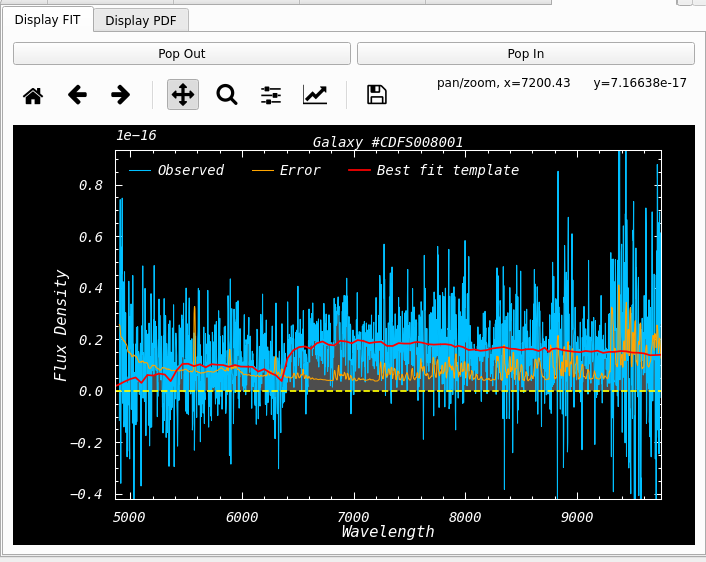
The GUI allows you to look at individual fits and PDF. Once you hit the button Show fit (of press f) the fit will be displayed in the display area. Two tabs will be created:
The fit display: This shows the data and their errors as well as the best fit selected by SPARTAN during the fitting process.
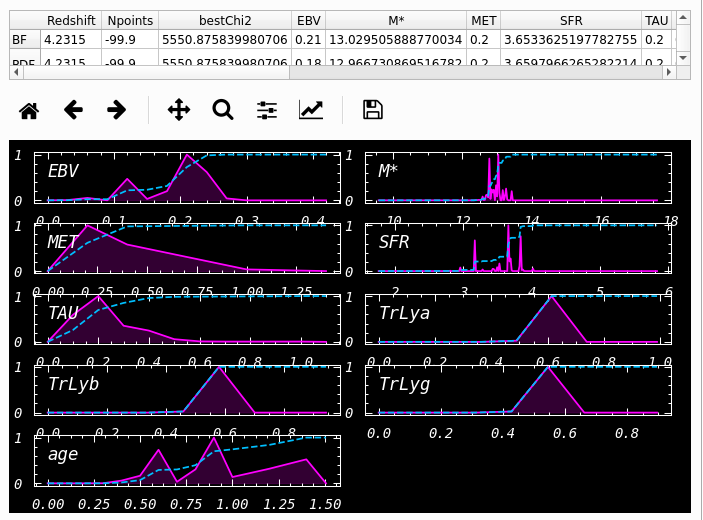
The parameter panel: This displays all the PDF of the parameters that have been computed. In each plot, we provide the PDF and the CDF. A table is also available to have a look at the final parameters values (both from the best fit template and from the PDF).
Vizualizing global results
The GUI allows you also to look at the parameters in a more general way. Two buttons have been designed for that:
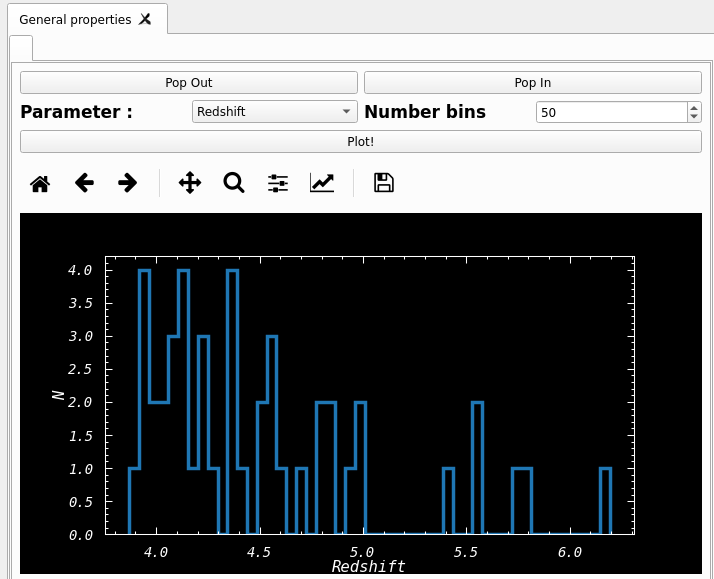
Show distribution: This allows you to have a quick look at parameter distribution. As you can see in the image below, you can select the parameter you want to see in the dropdown list and select the number of bins of your distribution. Once you made your selection, hit the Plot! button and the distribution will be displayed.
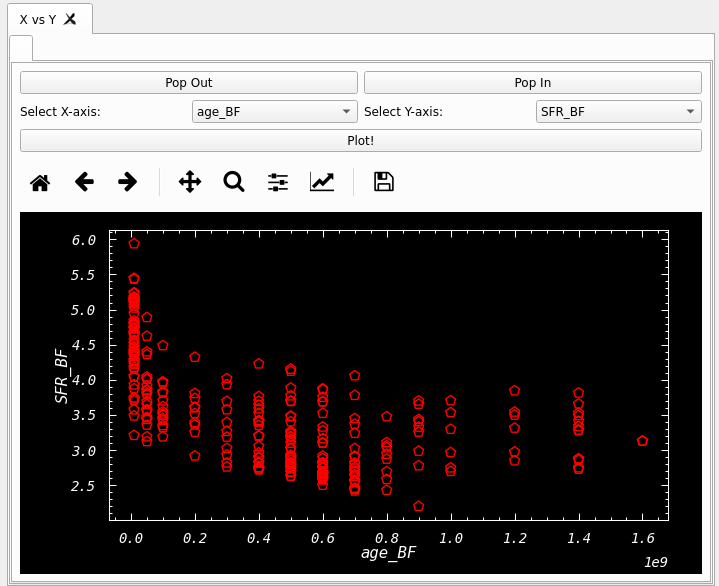
X vs Y: This allows you to plot one parameter versus another one as a scatter plot. You must select two parameters (x and y axis) and then hit the Plot! button. You can see an example below: