![]()
![]()
![]()
![]()
![]()
![]()
![]()
Using Photon
Installation
For the moment, the only way to use Photon is to download the source code from the Github repository (https://github.com/astrom-tom/Photon - using the ‘clone or download’ button and download as zip). To make it work you have to use python 3.6 with the following library and versions:
PyQt5 v5.10.1: The is for the graphical interface
Matplotlib v2.2.2: This is for the plotting area.
Numpy v1.14.2: catalog handling
Scipy v1.0.1: Some usefull function for smoothing / images
astropy v3.0.2: For fits image opening
Photon is available in the pypi repository. To install it:
1 | pip install photon_plot --user
|
The help
You start photon from a terminal. The program comes with a help that you can display in your terminal using the help command. Use it like this:
[user@machine]$ photon --help
This command will display the help of the program:
usage: photon [-h] [-f FILE] [-c CUSTOM] [-p PLOT] [-w WIDTH] [-d] [--version]

Photon, R. Thomas, 2018, This program comes with ABSOLUTELY NO WARRANTY; and
is distributed under the GPLv3.0 Licence terms.See the version of this Licence
distributed along this code for details. website: https://github.com/astrom-
tom/Photon

    -h, --help                show this help message and exit
    -f FILE, --file FILE      Your catalog of data to visualize, this is mandatory if
                              you do not use -p option
    -p PLOT, --plot PLOT      Saved plot configuration file, if none is given you
                              must provide a file
    -c CONF, --conf CONF      Properties configuration file. If none is givenm the
                              default configuration will be loaded
    -w WIDTH, --width WIDTH   Width of the GUI, default = 780
    --version                 display version of photon
In details it means:
Photon must come with a file as first argument OR configuration plot. If you do not give Photon one of these it will complain (you can see below for the format of the file you can provide photon with).
Few arguments can be used:
-f: this is a catalog you want to display
-p: Plot configuration. This plot configuration iscreated using the save button in the GUI. It allows you to reload a plot.
-c: Custom configuration file: If you saved a customization configuration previously you can load it using this argument and giving the cuztomization configuration.
-w: width of the window: The GUI is not resizable. Which means that the size of the plot is pre-fedined. By default the width of the window is sized at 780. Using this option, (e.g. -w 1080) will resize the GUI with a width of 1080.
-d: This will open the internal documentation
–version: Display in terminal the current version of the software
Catalog format
For the current version Photon accept only ascii catalogs of columns and fits image. Some precisions:
The catalog must contain at least 2 columns and 2 lines.
Each line must contain the same number of column.
If your catalog starts with a header the header must start with a hash ‘#’ and each column must be named.
When plotting images, The fits handling library that is used in Photon is called ‘fitsio’. Your image must contain only one table for the image. The fitsio command that is used is ‘fistio.read(‘image.fits’)’.
The Graphical User Interface
When starting Photon, the graphical interface shows up in the screen (Screenshot below).
It is composed of five area:
The plotting Area, where the plot will be displayed.
The matplotlib toolbar. Allows you to zoom in/out, select specific part of the plot, etc…
The ‘Add element in plot’ button. It is the button you will use to add elements in the plot such as Line plot, Scatter plot, histograms, strips, text, etc…
Graphical Elements Panel. Then you click in the previous button, the widgets for the graphical elements you want to use will be displayed in that area. The widgets depend on the type of element you want to add into the plot. (Available elements)
Customization Panel. This Panel remains the same all the time and help you to customize graphical properties of the plot itself such as: background color, axis tickness or color, ticks label size, fontsizes, etc. (Available Graphical customization)
When clicking on ‘Add element in plot’ you have these different choices:
line
line / new file
scatter
scatter /new file
histogram
histogram /new file
Error
Error / new file
Straight line
Span
Text
Image
Image / new file
All the plotting elements are described here: Available elements. As you can see some plotting elements are repeated (e.g. ‘line’ and ‘line / new file’). As you start Photon with a particular file it can be useful to be able to load data from another file. If this is the case you can use ‘XX / new file’ and Photon will open dialog window to choose another file to use in photon. When loading a pre-existing plot configuration, if you want to add more data to your plot, you will only have the ‘New file’ choices.
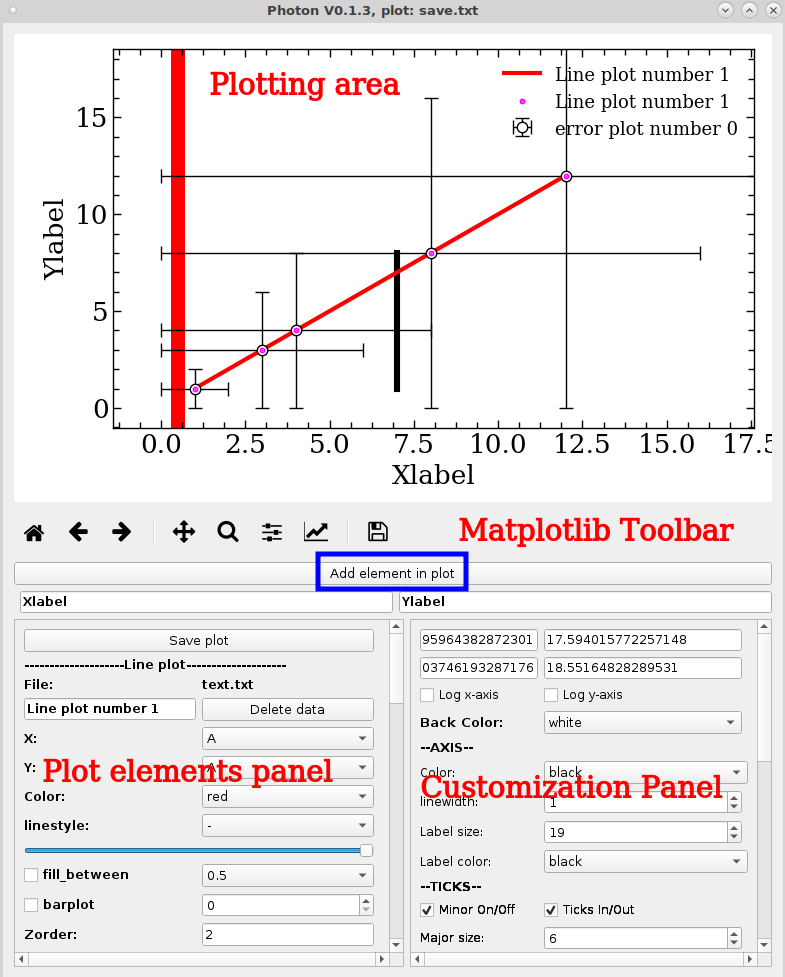
Fig2: GUI of Photon